National Portal Statistics
- The statistics are updated on monthly basis (Last update: 15th September, 2025).
- The Portal was launched on 23rd, May, 2007.
- Includes all transactions of the National Payments platform.
| Title | June 2025 | July 2025 | August 2025 |
|---|---|---|---|
| eServices Visits | 4,124,725 | 5,244,035 | 4,628,473 |
| Page Views | 7,418,944 | 9,643,517 | 8,385,366 |
| Number of Financial Transactions | 189,554 | 219,582 | 198,834 |
| Total Value of Financial Transactions (BD) | 55,919,246 | 69,388,729 | 51,470,168 |
| Number of pages viewed per visit | 6.2 | 6.3 | 6.3 |
| Average time spent per visit | 00:06:45 | 00:06:39 | 00:06:40 |
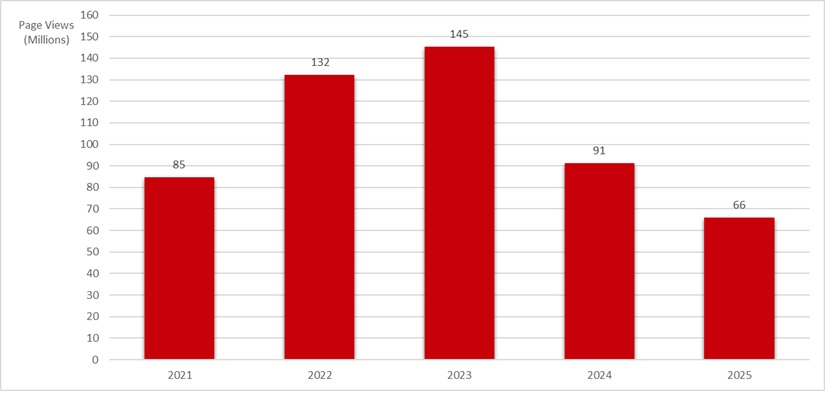
Annual Total Number of Page Views
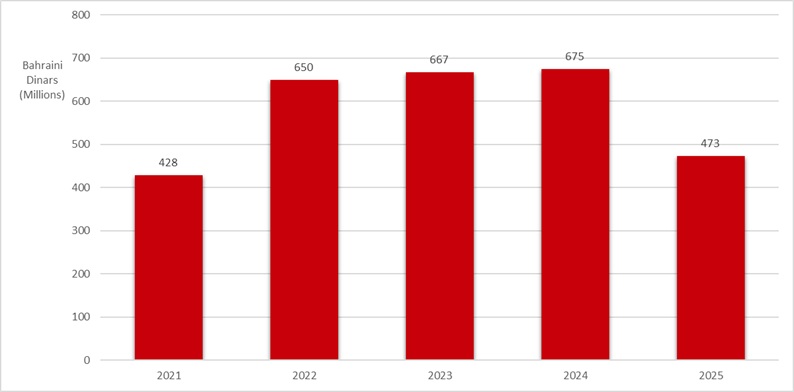
Annual Total Value of Financial Transactions
Content Last Updated: 15 Sep, 2025


