National Portal Statistics
- The statistics are updated on monthly basis (Last update: 15th March, 2025).
- The Portal was launched on 23rd, May, 2007.
- Includes all transactions of the National Payments platform.
| Title | December 2024 | January 2025 | February 2025 |
|---|---|---|---|
| eServices Visits | 4,279,904 | 3,761,182 | 4,304,132 |
| Page Views | 1,608,662 | 7,852,039 | 8,582,420 |
| Number of Financial Transactions | 200,428 | 207,153 | 209,937 |
| Total Value of Financial Transactions (BD) | 56,866,554 | 63,350,537 | 54,784,491 |
| Number of pages viewed per visit | 6.5 | 6.8 | 7.0 |
| Average time spent per visit | 00:07:28 | 00:07:36 | 00:07:08 |
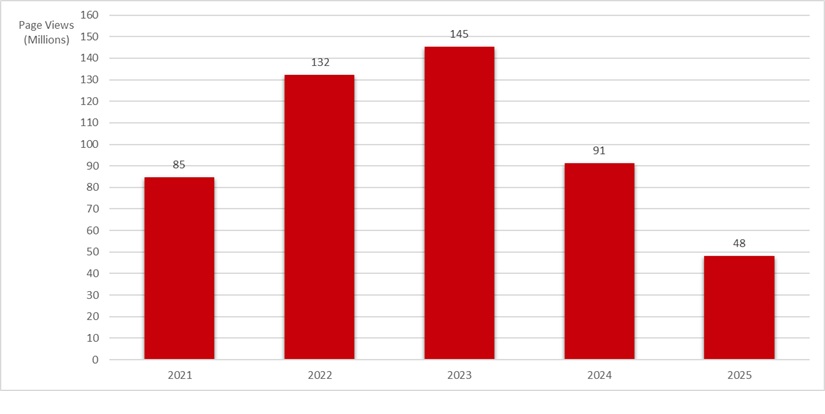
Annual Total Number of Page Views
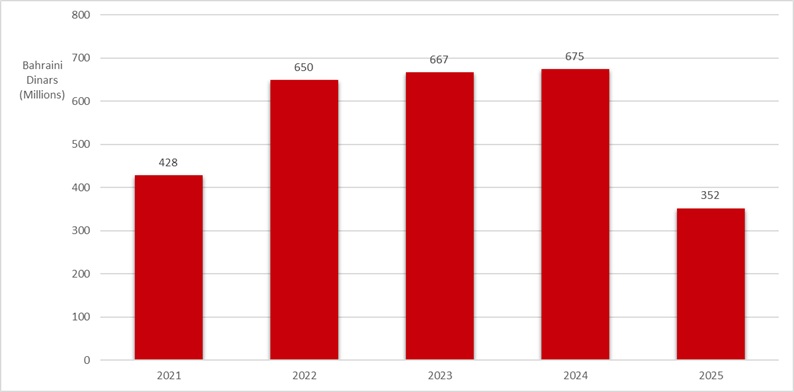
Annual Total Value of Financial Transactions
Content Last Updated: 15 Apr, 2025


