National Portal Statistics
- The statistics are updated on monthly basis (Last update: 15th July, 2025).
- The Portal was launched on 23rd, May, 2007.
- Includes all transactions of the National Payments platform.
| Title | April 2025 | May 2025 | June 2025 |
|---|---|---|---|
| eServices Visits | 4,705,562 | 4,488,341 | 4,124,725 |
| Page Views | 8,370,985 | 7,988,087 | 7,418,944 |
| Number of Financial Transactions | 208,456 | 203,908 | 189,554 |
| Total Value of Financial Transactions (BD) | 66,524,417 | 59,958,192 | 55,919,246 |
| Number of pages viewed per visit | 6.4 | 6.3 | 6.2 |
| Average time spent per visit | 00:06:56 | 00:06:57 | 00:06:45 |
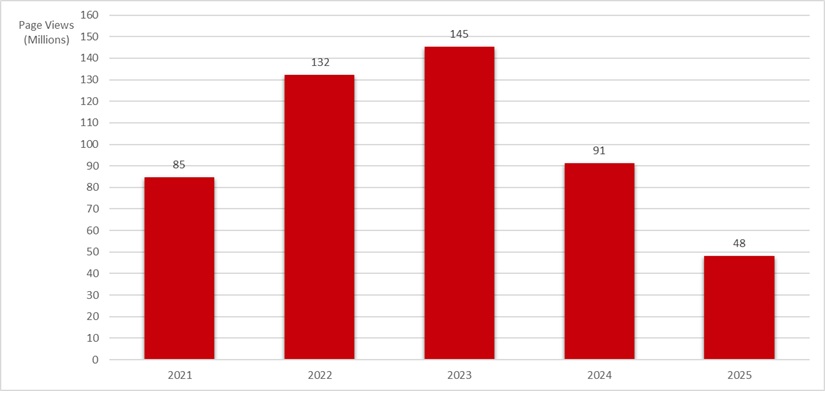
Annual Total Number of Page Views
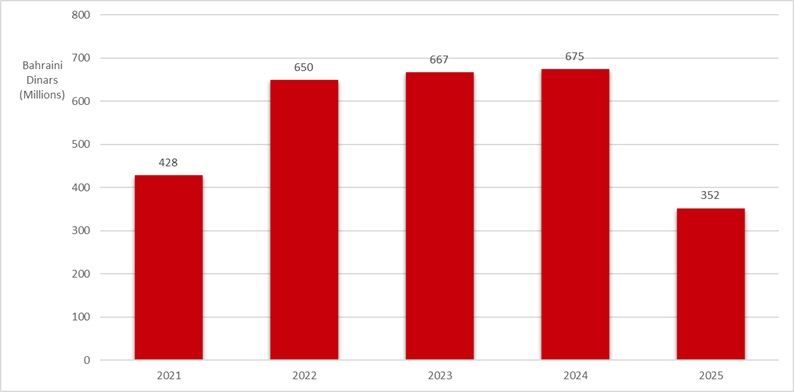
Annual Total Value of Financial Transactions
Content Last Updated: 20 Jul, 2025


